Fig. 11
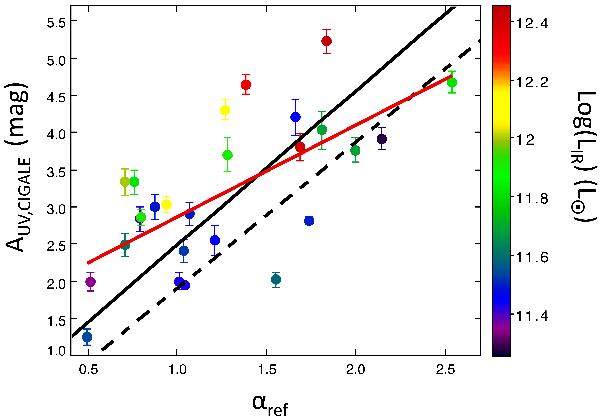
UV dust attenuations from CIGALE plotted against the slope of the UV continuum calculated with the full SED. The total IR luminosity is colour-coded. The solid and dashed lines correspond to the inner and total relations of Overzier et al. (2011) respectively. The error bars come from CIGALE (Bayesian estimates of the parameters and their associated errors). The red line is the result of the linear regression.
Current usage metrics show cumulative count of Article Views (full-text article views including HTML views, PDF and ePub downloads, according to the available data) and Abstracts Views on Vision4Press platform.
Data correspond to usage on the plateform after 2015. The current usage metrics is available 48-96 hours after online publication and is updated daily on week days.
Initial download of the metrics may take a while.