Fig. 3
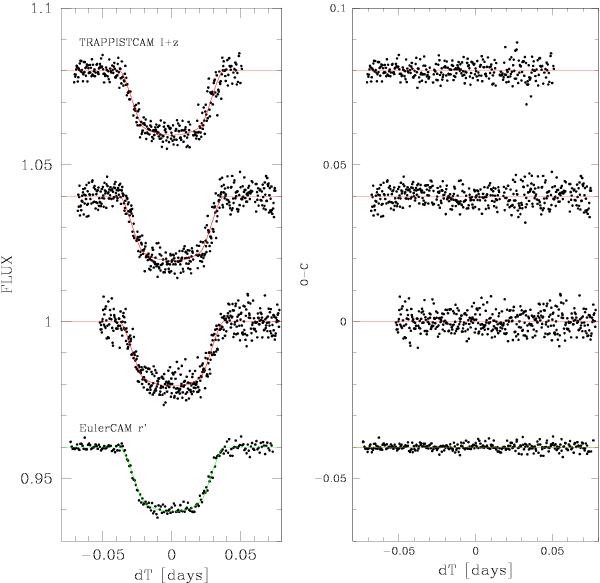
Left, from top to bottom: period-folded TRAPPIST transit light curves of WASP-50 for 2010 December 23, 25, and 27, and Euler transit light curve. These light curves are divided by the best-fitting baseline models (see details in Sect. 4), and the best-fitting transit models are superimposed. Three light curves and models are shifted in the y-axis for the sake of clarity. Right: the residuals to the fit for each light curve.
Current usage metrics show cumulative count of Article Views (full-text article views including HTML views, PDF and ePub downloads, according to the available data) and Abstracts Views on Vision4Press platform.
Data correspond to usage on the plateform after 2015. The current usage metrics is available 48-96 hours after online publication and is updated daily on week days.
Initial download of the metrics may take a while.