Fig. 8
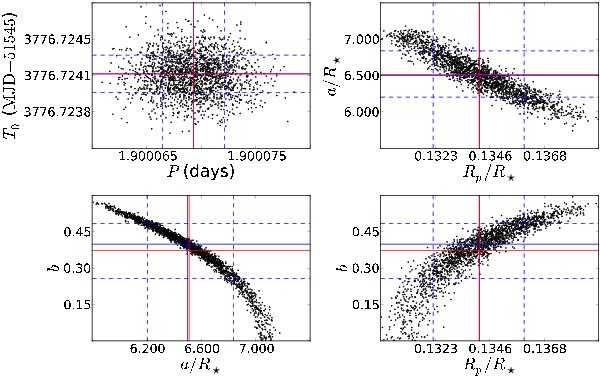
Examples of the results of the MCMC analysis with scatter plots showing the correlations between fitted parameters. Values corresponding to the best-fit (lowest χ2) solutions are indicated by red lines, while solid blue lines indicate the median values obtained for each parameter, and the dashed blue lines give the upper and lower 1-σ uncertainties. The best and median solutions coincide for several parameters.
Current usage metrics show cumulative count of Article Views (full-text article views including HTML views, PDF and ePub downloads, according to the available data) and Abstracts Views on Vision4Press platform.
Data correspond to usage on the plateform after 2015. The current usage metrics is available 48-96 hours after online publication and is updated daily on week days.
Initial download of the metrics may take a while.