Fig. 4
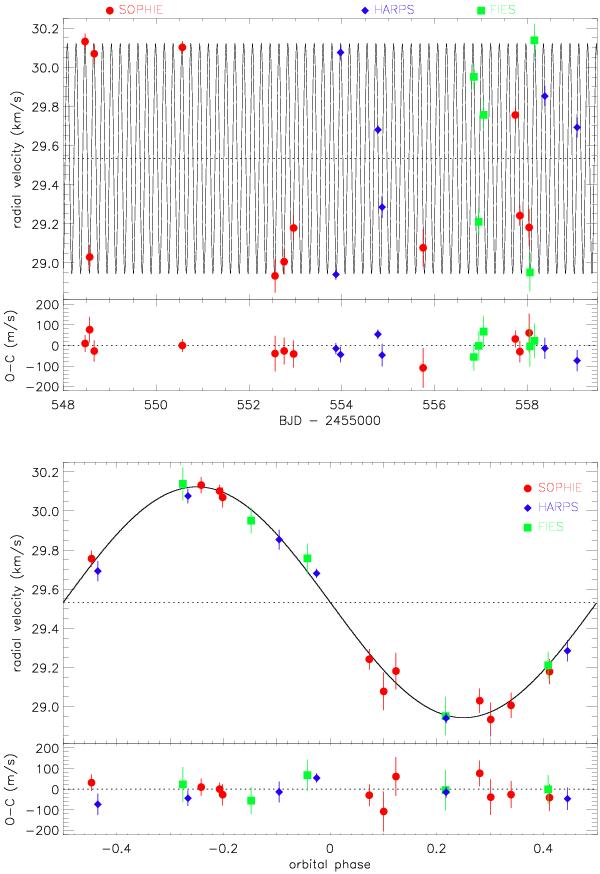
Upper panel: radial velocity measurements of CoRoT-18 with 1-σ error bars as a function of time together with their Keplerian fit (top) and residuals of the fit. The fit is described below in Sect. 4.4. Lower panel: same as above but as a function of the orbital phase. The data are from SOPHIE (red circles), HARPS (blue diamonds), and FIES (green squares).
Current usage metrics show cumulative count of Article Views (full-text article views including HTML views, PDF and ePub downloads, according to the available data) and Abstracts Views on Vision4Press platform.
Data correspond to usage on the plateform after 2015. The current usage metrics is available 48-96 hours after online publication and is updated daily on week days.
Initial download of the metrics may take a while.