Fig. 2
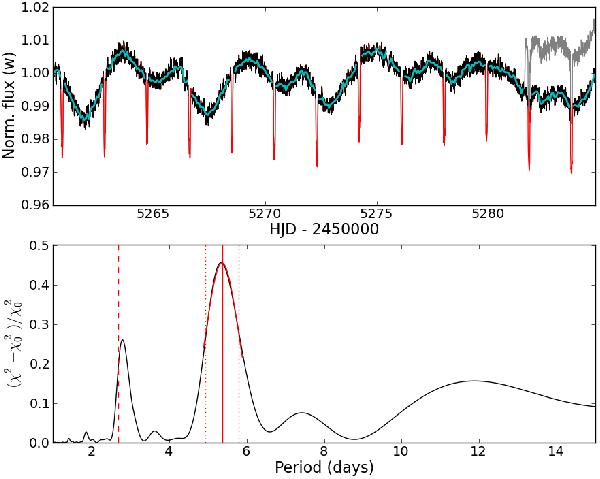
Top: CoRoT light curve in black with the 13 transits shown in red. All epochs in this paper are given in Heliocentric Julian Date (HJDUTC; Eastman et al. 2010). The original light curve (shown in gray) contained a discontinuity at HJD −2 450 000 = 5281.62, which was corrected by subtracting 15 mmag from data taken after this date. A linear fit to the light curve has also been used to remove any trend on timescales longer than the duration of the run. The light curve overplotted in blue is binned to one point per orbital period of the CoRoT satellite to make sure that no systematics from the rotation period can come through. Bottom: Lomb-Scargle periodogram of the out-of-transit light curve (black curve in top panel) as a function of relative improvement in χ2 compared to a constant flux model. It shows the stellar rotation signature at 5.4 ± 0.4 days (solid red line), as well as its first harmonic (dashed red line). Also shown are the Gaussian fit used to estimate the uncertainty in the stellar rotation period and the resulting 1-σ interval (dotted red lines).
Current usage metrics show cumulative count of Article Views (full-text article views including HTML views, PDF and ePub downloads, according to the available data) and Abstracts Views on Vision4Press platform.
Data correspond to usage on the plateform after 2015. The current usage metrics is available 48-96 hours after online publication and is updated daily on week days.
Initial download of the metrics may take a while.