Fig. 11
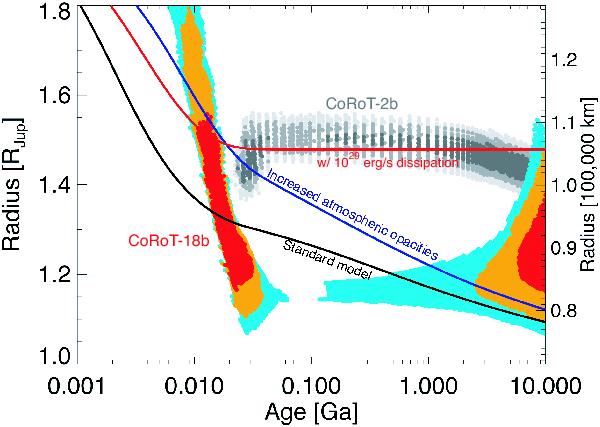
Constraints obtained on the age and radius of CoRoT-18b. The colored circles correspond to 1σ (red), 2σ (yellow), or 3σ (blue) solutions. The figure also plots the same constraints for CoRoT-2b (grayscale), when not including the effects of spots (see Czesla et al. 2009; Guillot & Havel 2011). The evolution tracks show the progressive contraction of a 3.5 MJup planet with Teq ~ 1600 K, in the so-called “standard approach”, when increasing atmospheric opacities by a factor 3.5, and when dissipating 1029 erg s-1 at the center (see Guillot & Havel 2011 for a description of the models).
Current usage metrics show cumulative count of Article Views (full-text article views including HTML views, PDF and ePub downloads, according to the available data) and Abstracts Views on Vision4Press platform.
Data correspond to usage on the plateform after 2015. The current usage metrics is available 48-96 hours after online publication and is updated daily on week days.
Initial download of the metrics may take a while.