Fig. 8
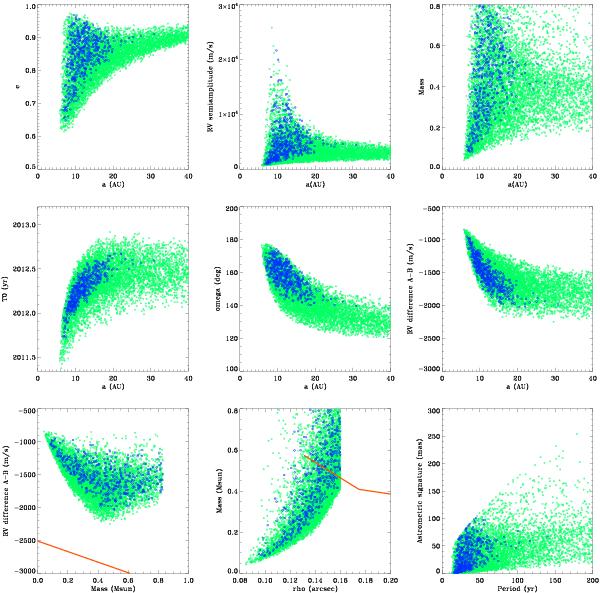
Results of the Monte Carlo simulation, showing the possible parameters that are compatible with the observed RV curve of HD 132563A. Starting from top left: eccentricity, RV semiamplitude, companion mass, time of periastron passage, longitude of periastron, RV difference between the components vs. semimajor axis; RV difference between the components vs. companion mass; companion mass vs. projected separation (at epoch 2007.548); astrometric amplitude vs. orbital period. Blue circles: solution with rms of residuals <15.7 m/s; Green circles (light gray in BW): solution with rms of residuals 15.7−18.5 m/s. The red solid line in the mass vs. RV difference panel is the limit that allows the wide pair to be bound. The red solid line in the companion mass vs. projected separation panel shows AdOpt-at-TNG detection limits.
Current usage metrics show cumulative count of Article Views (full-text article views including HTML views, PDF and ePub downloads, according to the available data) and Abstracts Views on Vision4Press platform.
Data correspond to usage on the plateform after 2015. The current usage metrics is available 48-96 hours after online publication and is updated daily on week days.
Initial download of the metrics may take a while.