Free Access
Fig. 4
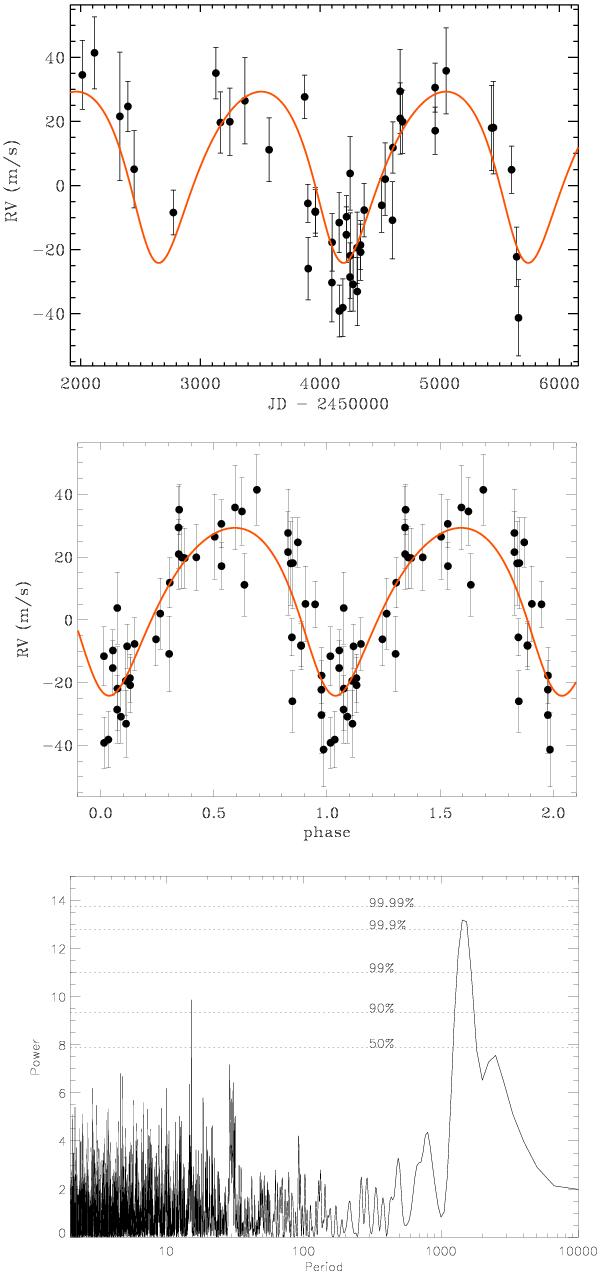
Upper panel: radial velocities of HD 132563 B, overplotted is the Keplerian best fit. Central panel: radial velocities phased to the best-fit period. Lower panel: Lomb-Scargle periodogram of the radial velocities. Overplotted are the various confidence levels as derived from the bootstrap analysis.
This figure is made of several images, please see below:
Current usage metrics show cumulative count of Article Views (full-text article views including HTML views, PDF and ePub downloads, according to the available data) and Abstracts Views on Vision4Press platform.
Data correspond to usage on the plateform after 2015. The current usage metrics is available 48-96 hours after online publication and is updated daily on week days.
Initial download of the metrics may take a while.