Fig. 7
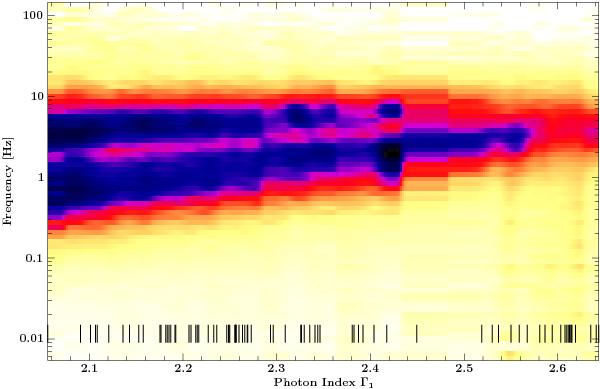
Variation of the 4.5 − 5.8 keV power spectrum with the photon index Γ1. A darker color code indicates a higher value of f × PSD(f). Dashes at the bottom show the photon indices of the individual spectra. Intermediate values are interpolated with a Gaussian blur. With increasing photon index the variability components shift to higher frequencies and their intensity decreases (in this energy band L2 completely fades out toward Γ1 ~ 2.6).
Current usage metrics show cumulative count of Article Views (full-text article views including HTML views, PDF and ePub downloads, according to the available data) and Abstracts Views on Vision4Press platform.
Data correspond to usage on the plateform after 2015. The current usage metrics is available 48-96 hours after online publication and is updated daily on week days.
Initial download of the metrics may take a while.