Fig. 5
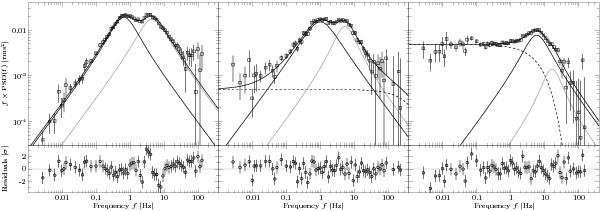
Examples of characteristic power spectra. The solid gray lines show the Lorentzian profiles, and the dashed gray lines a cutoff power law Left: PSD from an observation with one of the hardest spectra in our data set. f × PSD(f) vanishes for low frequencies and shows a double-humped shape, with no requirement for a power law in addition to the two Lorentzians. There is a slight indication for a third Lorentzian profile with a peak frequency between about 40 − 80 Hz. Middle: PSD obtained from a transitional state, requiring an additional power law at low frequencies. Right: PSD in the soft state, with yet stronger contribution of the power law. This sequence of power spectra shows that the Lorentzian peaks shift to higher frequencies as the X-ray spectrum becomes softer.
Current usage metrics show cumulative count of Article Views (full-text article views including HTML views, PDF and ePub downloads, according to the available data) and Abstracts Views on Vision4Press platform.
Data correspond to usage on the plateform after 2015. The current usage metrics is available 48-96 hours after online publication and is updated daily on week days.
Initial download of the metrics may take a while.