Fig. 2
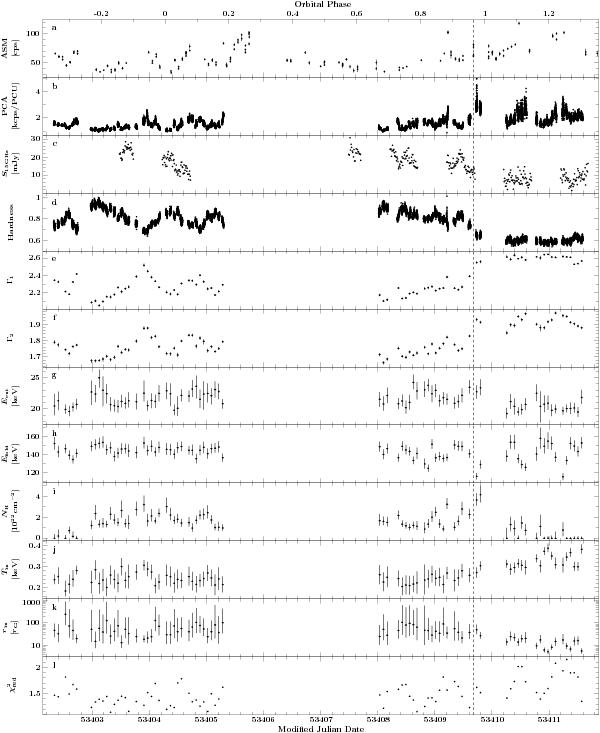
Temporal evolution of the count rates and spectral parameters of Cyg X-1 during the observation period. The upper three panels are the light curves of Cyg X-1 measured with a) RXTE-ASM (1.5 − 12 keV); b) PCA (total energy range 2 − 60 keV) and c) the Ryle Telescope (at 15 GHz). d) The hardness is the same as in Fig. 12, namely the ratio of the PCA count rates in the energy bands (9.5 − 15 keV)/(4.5 − 5.8 keV). The bottom panels show the temporal evolution of e) the photon index Γ1; f) the photon index above the spectral break Γ2; g) the cutoff and h) folding energy of the high-energy cutoff; i) the hydrogen column; j) the inner temperature and k) the inner radius of the accretion disk; and l) the reduced χ2 of the best fits. The dashed vertical line indicates the transition.
Current usage metrics show cumulative count of Article Views (full-text article views including HTML views, PDF and ePub downloads, according to the available data) and Abstracts Views on Vision4Press platform.
Data correspond to usage on the plateform after 2015. The current usage metrics is available 48-96 hours after online publication and is updated daily on week days.
Initial download of the metrics may take a while.