Fig. 11
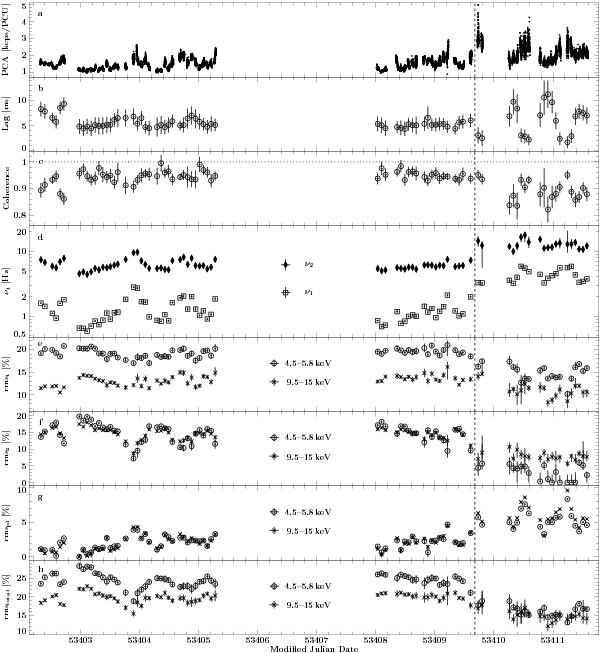
Evolution of the timing parameters during the observation. The upper panel a) shows the PCA light curve of Fig. 2b for comparison; b) the averaged time lag in the 3 − 10 Hz band; c) coherence in the 3 − 10 Hz band; and d) Lorentzian peak frequencies. The following panels show the rms in both energy bands (circles for the 4.5 − 5.8 keV band and crosses for the 9.5 − 15 keV band) of the components: e) rms of L1; f) of L2; g) the power law; and h) the total rms.
Current usage metrics show cumulative count of Article Views (full-text article views including HTML views, PDF and ePub downloads, according to the available data) and Abstracts Views on Vision4Press platform.
Data correspond to usage on the plateform after 2015. The current usage metrics is available 48-96 hours after online publication and is updated daily on week days.
Initial download of the metrics may take a while.