Fig. 1
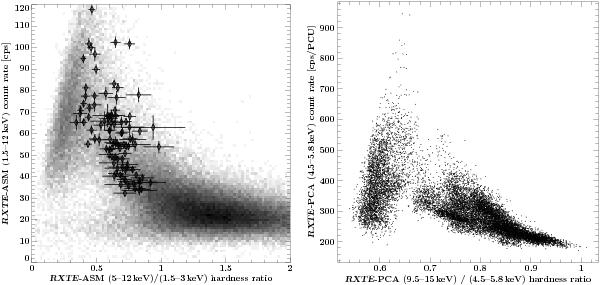
Left: hardness-intensity-diagram of Cyg X-1 using RXTE-ASM data. The hardness is defined here as the ratio of the 5 − 12 keV and the 1.5 − 3 keV ASM count rates; the intensity is the total 1.5 − 12 keV ASM count rate (see also Fender et al. 2006, their Fig. 5). The grayscale represents the single-dwell (90 s) ASM-data from 1996 January until 2010 August. Their characteristic density forms two regions in the HID, indicating two different states. The data analyzed in this work (black symbols) cover the transition region. Right: the transitional nature of the observation is confirmed by the HID calculated from 16 s PCA data.
Current usage metrics show cumulative count of Article Views (full-text article views including HTML views, PDF and ePub downloads, according to the available data) and Abstracts Views on Vision4Press platform.
Data correspond to usage on the plateform after 2015. The current usage metrics is available 48-96 hours after online publication and is updated daily on week days.
Initial download of the metrics may take a while.