Fig. 8
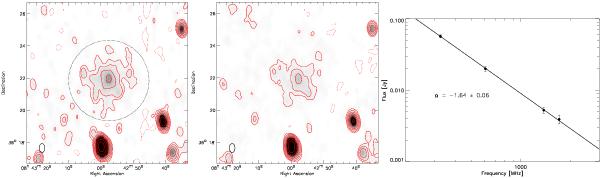
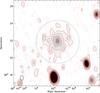
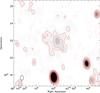
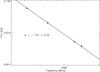
Left: WSRT 1382 MHz image of Abel 697. Contour levels are drawn as in Fig. 1. Black dotted lines indicate the integration area for the flux measurements. Middle: WSRT 1714 MHz image of Abell 697. Contour levels are drawn as in Fig. 1. Right: A697 radio halo spectrum. Flux measurements at 325 and 610 MHz are taken from Macario et al. (2010).
Current usage metrics show cumulative count of Article Views (full-text article views including HTML views, PDF and ePub downloads, according to the available data) and Abstracts Views on Vision4Press platform.
Data correspond to usage on the plateform after 2015. The current usage metrics is available 48-96 hours after online publication and is updated daily on week days.
Initial download of the metrics may take a while.