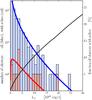
Fig. 26
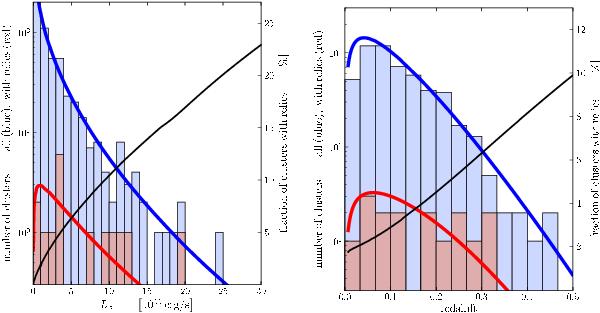
Histograms showing the X-ray luminosity (left) and redshift (right) distribution. Blue histograms shows the NORAS-REFLEX sample, red the relic cluster sample. The solid blue line displays the predicted luminosity/redshift distributions from Nuza et al. (2011) for clusters with fluxes >3.0 × 10⁻¹² erg s-1 cm-2 , while the solid red line is the prediction for clusters hosting relics in the simulation. The fraction of clusters with relics is given by the black solid line (the ratio of the blue and red lines).
Current usage metrics show cumulative count of Article Views (full-text article views including HTML views, PDF and ePub downloads, according to the available data) and Abstracts Views on Vision4Press platform.
Data correspond to usage on the plateform after 2015. The current usage metrics is available 48-96 hours after online publication and is updated daily on week days.
Initial download of the metrics may take a while.