Fig. 23
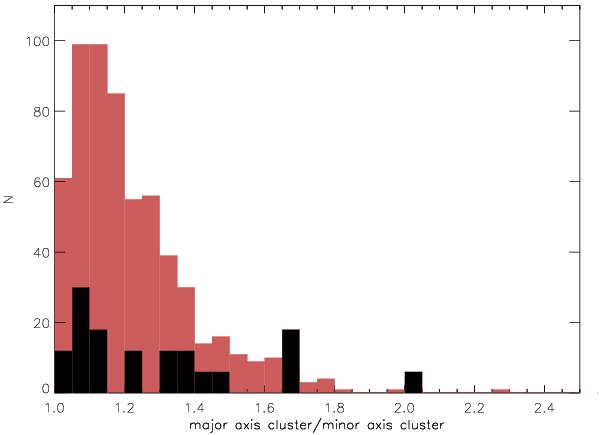
Histograms showing the distribution of the major and minor axis ratio. The red histogram is for clusters from the NORAS and REFLEX surveys, the black histogram is for clusters containing giant radio relics (see the caption of Fig. 22). The black histogram was scaled by a factor of six for easier comparison with the NORAS-REFLEX sample. Clusters for which the 2 dimensional Gaussian fit did not converge were not included.
Current usage metrics show cumulative count of Article Views (full-text article views including HTML views, PDF and ePub downloads, according to the available data) and Abstracts Views on Vision4Press platform.
Data correspond to usage on the plateform after 2015. The current usage metrics is available 48-96 hours after online publication and is updated daily on week days.
Initial download of the metrics may take a while.