Free Access
Fig. 2
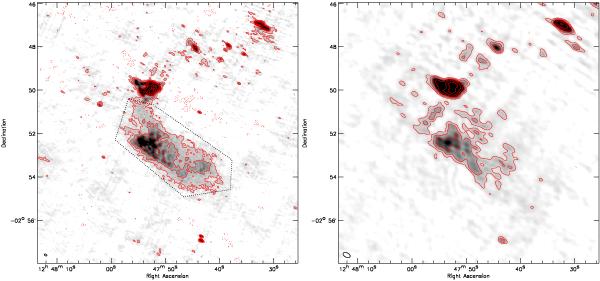
GMRT 610 (left) and 241 MHz (right) image of A1612. Contour levels are drawn as in Fig. 1. Black dotted lines in the 610 MHz image indicate the integration area for the flux measurements.
This figure is made of several images, please see below:
Current usage metrics show cumulative count of Article Views (full-text article views including HTML views, PDF and ePub downloads, according to the available data) and Abstracts Views on Vision4Press platform.
Data correspond to usage on the plateform after 2015. The current usage metrics is available 48-96 hours after online publication and is updated daily on week days.
Initial download of the metrics may take a while.