Fig. 14
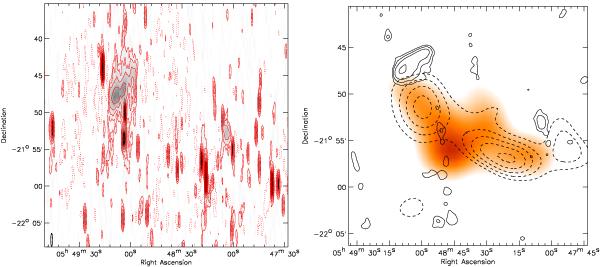
Left: A3365 WSRT 1382 MHz image. Contour levels are drawn as in Fig. 1. Right: A3365 X-ray emission from ROSAT in orange. The original image from the ROSAT All Sky Survey was convolved with a 225″ FWHM Gaussian. Solid contours are from a VLA 1.4 GHz image with compact sources subtracted from the uv-data. This DnC array image has a resolution of 47″ × 42″. Contours are drawn at levels of [1,2,4,8,...] × 0.4 mJy beam-1. Dashed contours show the galaxy iso-density distribution derived from INT images. Contours are drawn at [1.0,1.1,1.2,...] × 0.78 galaxies arcmin-2 selecting only galaxies with colors 0.6 < V − R < 0.9, 0.54 < R − I < 0.84, i.e., within 0.15 mag the V − R and R − I color of the largest cD galaxy.
Current usage metrics show cumulative count of Article Views (full-text article views including HTML views, PDF and ePub downloads, according to the available data) and Abstracts Views on Vision4Press platform.
Data correspond to usage on the plateform after 2015. The current usage metrics is available 48-96 hours after online publication and is updated daily on week days.
Initial download of the metrics may take a while.