Fig. 1
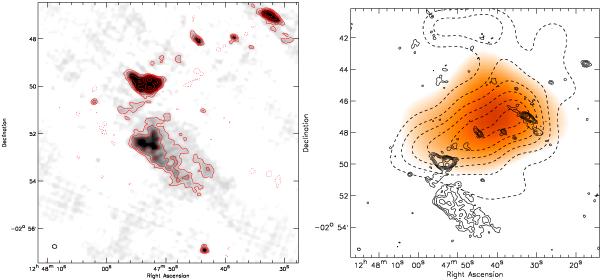
Left: GMRT 325 MHz image of Abell 1612. Radio contours are drawn at levels of [1,2,4,...] × 4σrms. Dashed contours are drawn at −3σrms. Right: A1612 X-ray emission from ROSAT, tracing the thermal ICM, is shown by the color image. The original image from the ROSAT All Sky Survey was convolved with a 270″ FWHM Gaussian. Solid contours are from the GMRT 325 MHz image and drawn at levels of [1,2,4,...] × 3σrms. Dashed contours show the galaxy iso-density distribution derived from the SDSS survey. Contours are drawn at [1.0,1.4,1.8,...] × 1.1 galaxies arcmin-2 selecting only galaxies with 0.16 < zphot < 0.20.
Current usage metrics show cumulative count of Article Views (full-text article views including HTML views, PDF and ePub downloads, according to the available data) and Abstracts Views on Vision4Press platform.
Data correspond to usage on the plateform after 2015. The current usage metrics is available 48-96 hours after online publication and is updated daily on week days.
Initial download of the metrics may take a while.