Fig. 7
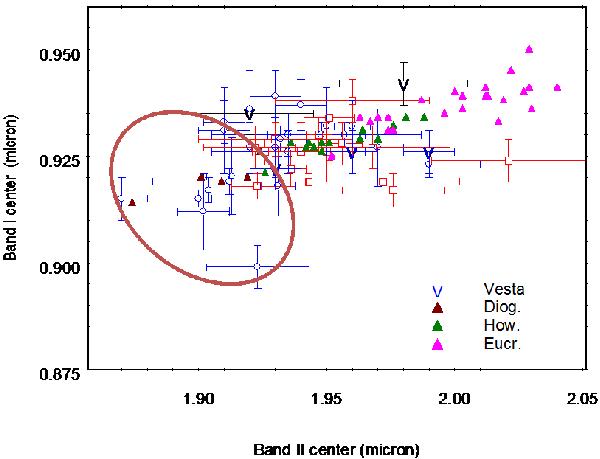
Values of BI center vs BII center for our sample of asteroids and for HEDs. Blue dots represent asteroids that are not members of the Vesta dynamical family, red squares represent those that are. The V symbols indicate (4) Vesta: black from Gaffey (1997) (the two points represent the maximum and minimum values over a rotational periods with the associated errors), blue from Vernazza et al. (2005). The brown circle indicates the region where the diogenite-like asteroids are located.
Current usage metrics show cumulative count of Article Views (full-text article views including HTML views, PDF and ePub downloads, according to the available data) and Abstracts Views on Vision4Press platform.
Data correspond to usage on the plateform after 2015. The current usage metrics is available 48-96 hours after online publication and is updated daily on week days.
Initial download of the metrics may take a while.