Free Access
Fig. 2
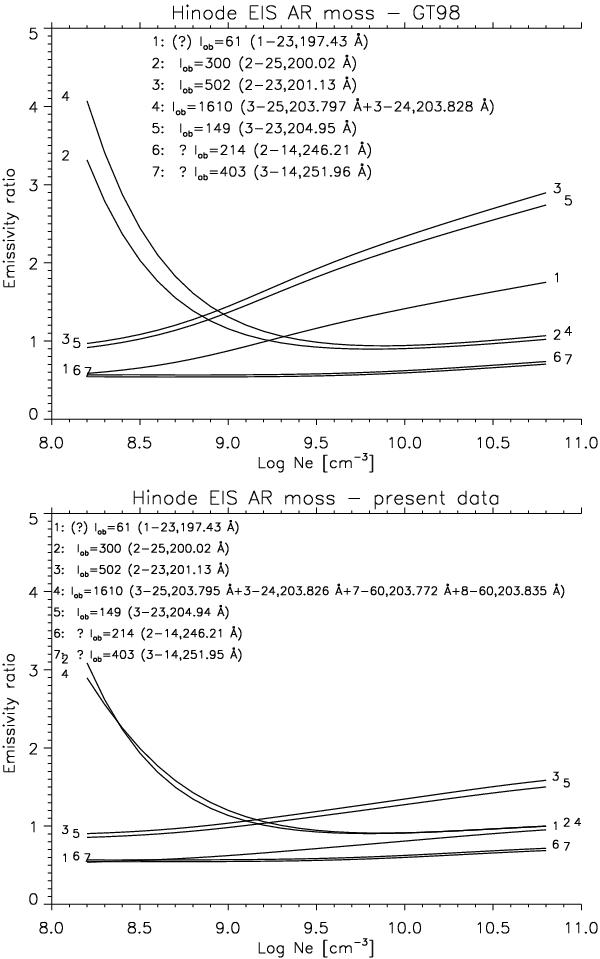
Emissivity ratio curves for a selection of strong lines observed with Hinode/EIS. The upper plot is obtained with the GT98 atomic data, and the lower one with the SZ10 ones. Intensities are given in phot cm-2 s-1 sr-1.
Current usage metrics show cumulative count of Article Views (full-text article views including HTML views, PDF and ePub downloads, according to the available data) and Abstracts Views on Vision4Press platform.
Data correspond to usage on the plateform after 2015. The current usage metrics is available 48-96 hours after online publication and is updated daily on week days.
Initial download of the metrics may take a while.