Fig. 9
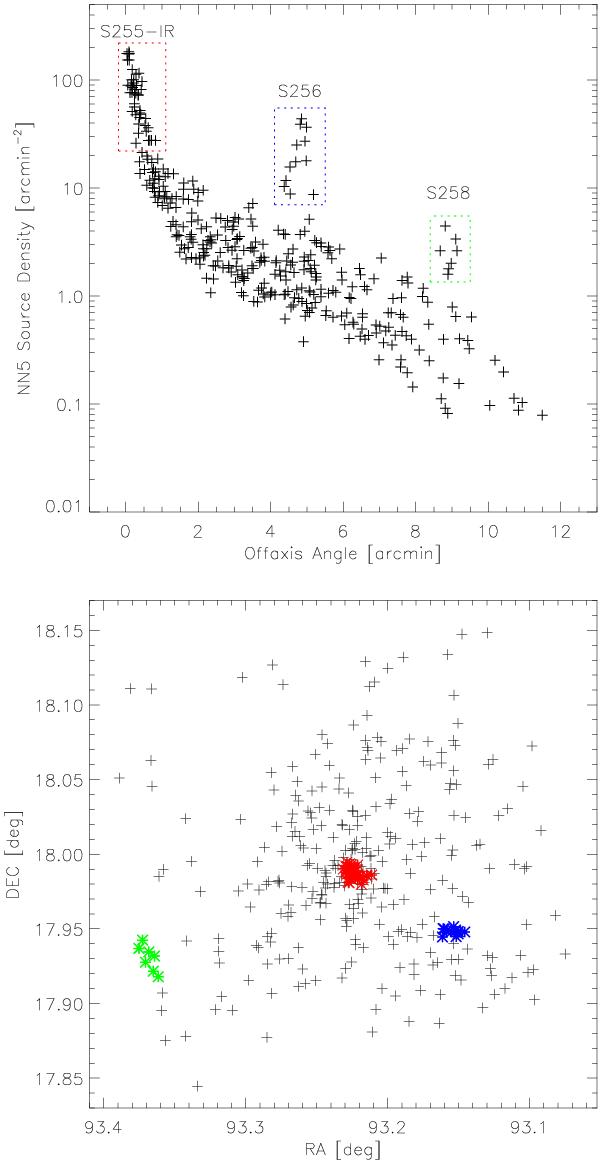
Top: nearest neighbor analysis surface density at the location of each X-ray source plotted against the offaxis-angle. The general decrease of density with increasing offaxis-angle is related to instrumental effects. The dot-lined boxes mark the members of the three identified clusters. Bottom: spatial distribution of the X-ray sources. The members of the three clusters marked in the top plot are show by the colored asterisks.
Current usage metrics show cumulative count of Article Views (full-text article views including HTML views, PDF and ePub downloads, according to the available data) and Abstracts Views on Vision4Press platform.
Data correspond to usage on the plateform after 2015. The current usage metrics is available 48-96 hours after online publication and is updated daily on week days.
Initial download of the metrics may take a while.