Fig. 8
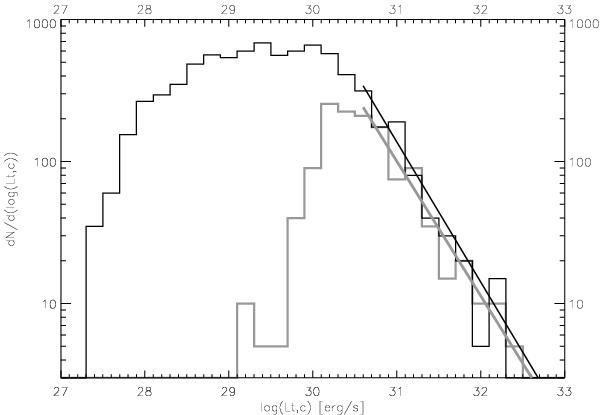
Comparison of the XLF of S254-S258 (thick grey line) to the XLF of the Orion Nebula Cluster (from the COUP data; Getman et al. 2005b, black line). The straight lines show the results of the power-law fits to the distributions in the luminosity range LX = 1030.5−1032.0 erg s-1.
Current usage metrics show cumulative count of Article Views (full-text article views including HTML views, PDF and ePub downloads, according to the available data) and Abstracts Views on Vision4Press platform.
Data correspond to usage on the plateform after 2015. The current usage metrics is available 48-96 hours after online publication and is updated daily on week days.
Initial download of the metrics may take a while.