Fig. 7
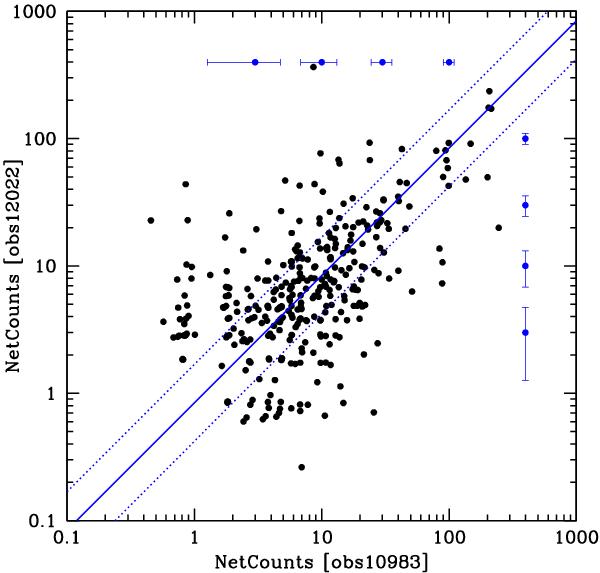
This plot shows for each X-ray source the net counts in the first pointing compared to the net counts in the second pointing (obtained about 4 days later). The sequence of blue error bars at the upper and right edge show the Poisson statistical uncertainties for different numbers of net counts. The solid line indicates the expected relation for sources with constant count rates in the two pointings; the dotted lines are offset by factors of 2.
Current usage metrics show cumulative count of Article Views (full-text article views including HTML views, PDF and ePub downloads, according to the available data) and Abstracts Views on Vision4Press platform.
Data correspond to usage on the plateform after 2015. The current usage metrics is available 48-96 hours after online publication and is updated daily on week days.
Initial download of the metrics may take a while.