Free Access
Fig. 2
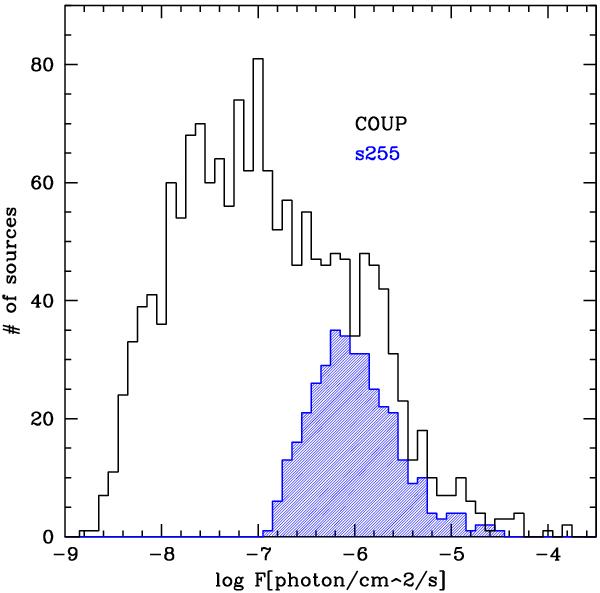
The blue histogram shows the distribution of FLUX2 values for the X-ray sources in S254-S258. For comparison, the distribution of fluxes from the COUP data from Getman et al. (2005b) is shown by the black histogram, scaled to the distance of S254-S258, i.e. 1.6 kpc.
Current usage metrics show cumulative count of Article Views (full-text article views including HTML views, PDF and ePub downloads, according to the available data) and Abstracts Views on Vision4Press platform.
Data correspond to usage on the plateform after 2015. The current usage metrics is available 48-96 hours after online publication and is updated daily on week days.
Initial download of the metrics may take a while.