Fig. 1
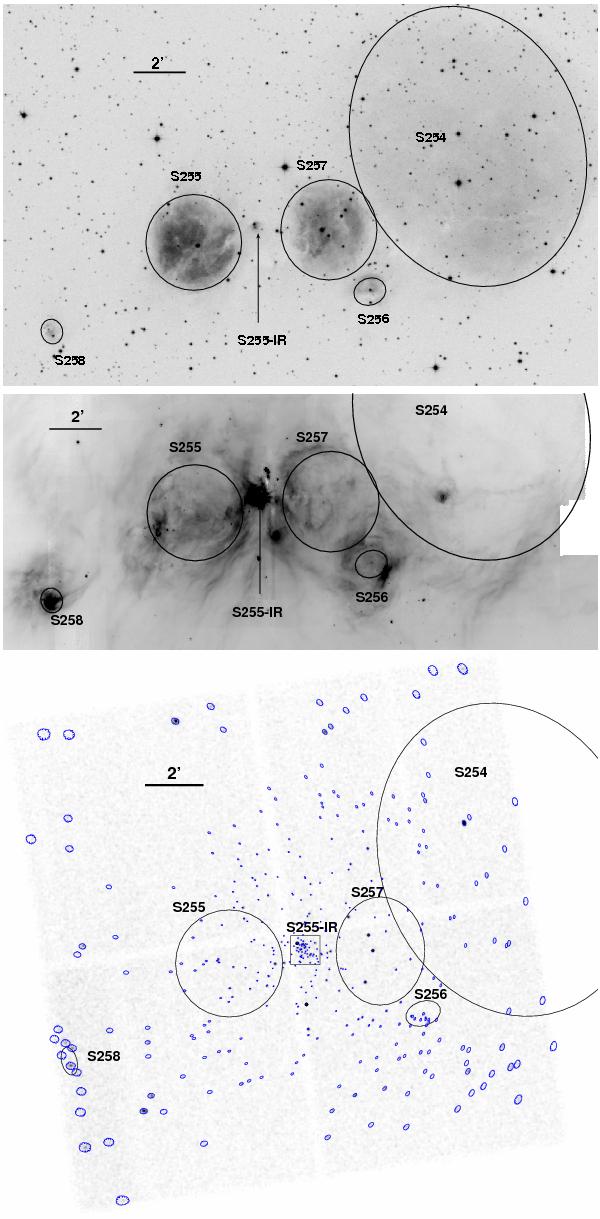
Top: negative grayscale representation of the optical image of the S254-S258 complex from the Digitized Sky Survey. The black ellipses represent the five H ii regions that define the complex. The location of the central, optically invisible embedded cluster S255-IR is marked by the arrow. Center: Spitzer IRAC 4 image of the central part of the S254-S258 complex. This image was created from the basic calibrated data products for the programs 201 and 30784 retrieved from the Spitzer archive and mosaicked with the MOPEX software available from the Spitzer Science Center. Note that parts of the bright emission from the central embedded cluster S255-IR is saturated in these data. Bottom: Chandra ACIS-I image of S254-S258 in the [0.5–8.0] keV band. Blue ellipsoids represent extraction regions for the individual detected X-ray sources based on a model of the local PSF that encircles 90% of total energy.
Current usage metrics show cumulative count of Article Views (full-text article views including HTML views, PDF and ePub downloads, according to the available data) and Abstracts Views on Vision4Press platform.
Data correspond to usage on the plateform after 2015. The current usage metrics is available 48-96 hours after online publication and is updated daily on week days.
Initial download of the metrics may take a while.