Free Access
Fig. 1
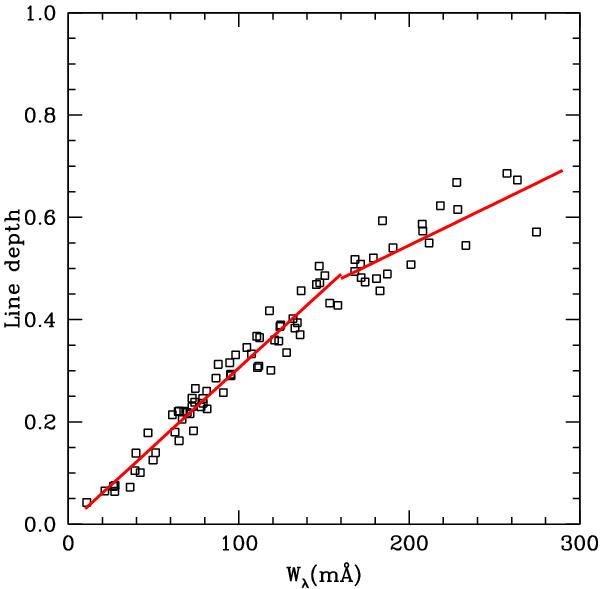
Line depth vs. equivalent width of Fe i lines of CD-25 6606. This plot shows that there is a change in the slope around 160 mÅ which was used to set this limit for the equivalent widths in our abundance analysis.
Current usage metrics show cumulative count of Article Views (full-text article views including HTML views, PDF and ePub downloads, according to the available data) and Abstracts Views on Vision4Press platform.
Data correspond to usage on the plateform after 2015. The current usage metrics is available 48-96 hours after online publication and is updated daily on week days.
Initial download of the metrics may take a while.