Fig. 9
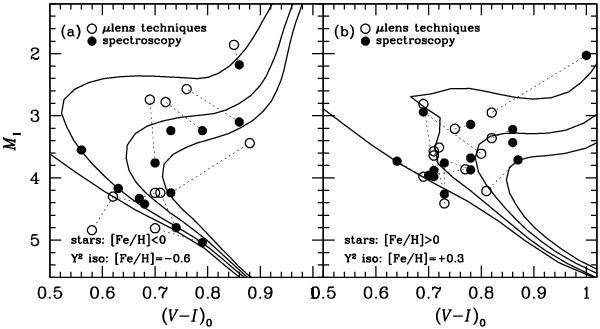
a, b) Show the (V − I)0 versus MI colour–magnitude diagram using values from microlensing techniques (open circles) and spectroscopy (filled circles). a) Shows the stars with [Fe/H] < 0 and b) the stars with [Fe/H] > 0. Each CMD also show the Y2 isochrones (1, 5, 10, and 15 Gyr) from Demarque et al. (2004). For the metal-poor sample the isochrones have [Fe/H] = −0.6 and for the metal-rich sample [Fe/H] = + 0.3. The spectroscopic and microlensing values have been connected with a dashed line for each star (4 stars do not have microlensing values).
Current usage metrics show cumulative count of Article Views (full-text article views including HTML views, PDF and ePub downloads, according to the available data) and Abstracts Views on Vision4Press platform.
Data correspond to usage on the plateform after 2015. The current usage metrics is available 48-96 hours after online publication and is updated daily on week days.
Initial download of the metrics may take a while.