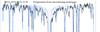
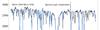
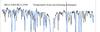
Fig. 3
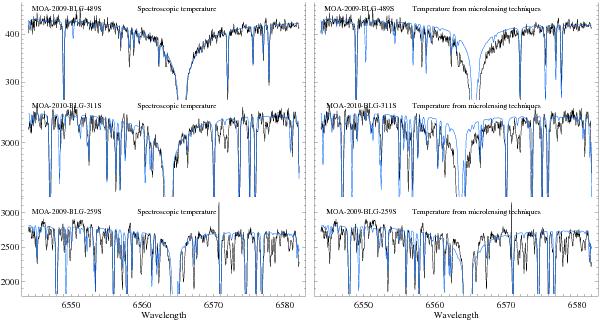
Synthesis of the Hα line at 6563 Å for the three stars that show large deviations between the spectroscopic effective temperatures and the effective temperatures based on microlensing techniques. Observed spectra are shown with black lines, and the synthetic spectra with blue lines. Left-hand side shows the synthetic profiles based on spectroscopic temperatures and the right-hand side the profiles based on temperatures from microlensing techniques. The microlensing temperature for MOA-2010-BLG-311S is the one based on the original (V − I)0 colour (i.e. K). Note that no attempts to match individual lines has been made. The composition of the model atmospheres are simply scaled with [Fe/H] relative to the standard solar composition by Grevesse et al. (2007).


Current usage metrics show cumulative count of Article Views (full-text article views including HTML views, PDF and ePub downloads, according to the available data) and Abstracts Views on Vision4Press platform.
Data correspond to usage on the plateform after 2015. The current usage metrics is available 48-96 hours after online publication and is updated daily on week days.
Initial download of the metrics may take a while.