Fig. 13
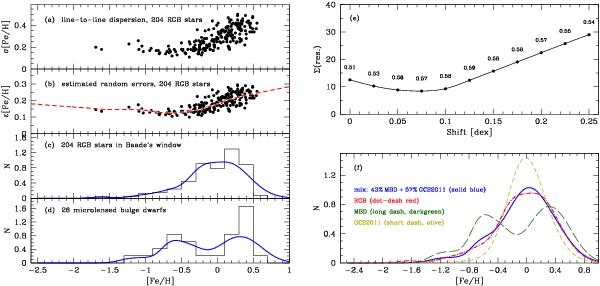
a) Line-to-line dispersion of Fe i abundances for the 204 RGB stars from Zoccali et al. (2008); b) the estimated random errors of the 204 RGB stars from Zoccali et al. (2008). Dashed red line represents the running median (extrapolated outside the data limits); c) the MDF for the 204 RGB stars. The blue line is a smoothed version where each star is represented by a Gaussian having with a width equal to the estimated random error as shown inb); d) the MDF for the microlensed dwarf stars. The blue line is a smoothed version where each star is represented by a Gaussian with a width as given by the dashed line in b); e) shows how the sum of the minimum residual between a joint disk GCS and microlensed dwarf MDF and the RGB MDF vary with the shift of the GCS disk sample. For each value, the fraction of the GCS disk MDF is shown. The minimum sum of residuals is reached when the disk GCS MDF is shifted + 0.075 dex, and when the fraction of GCS disk MDF is 57%. The MDFs and the smeared MDFs for the RGB sample in Baade’s window; f) the smoothed MDFs for the RGB sample (red dash-dotted line), the microlensed dwarf sample (green long-dashed line), the GCS2011 disk sample (olive coloured short-dashed line). The solid blue line shows the mix of the MDFs from the GCS2011 disk sample and the microlensed dwarf sample that best match the RGB MDF. All MDFs have been normalised to unit area (hence N on the ordinates are arbitrary numbers).
Current usage metrics show cumulative count of Article Views (full-text article views including HTML views, PDF and ePub downloads, according to the available data) and Abstracts Views on Vision4Press platform.
Data correspond to usage on the plateform after 2015. The current usage metrics is available 48-96 hours after online publication and is updated daily on week days.
Initial download of the metrics may take a while.