Fig. 3
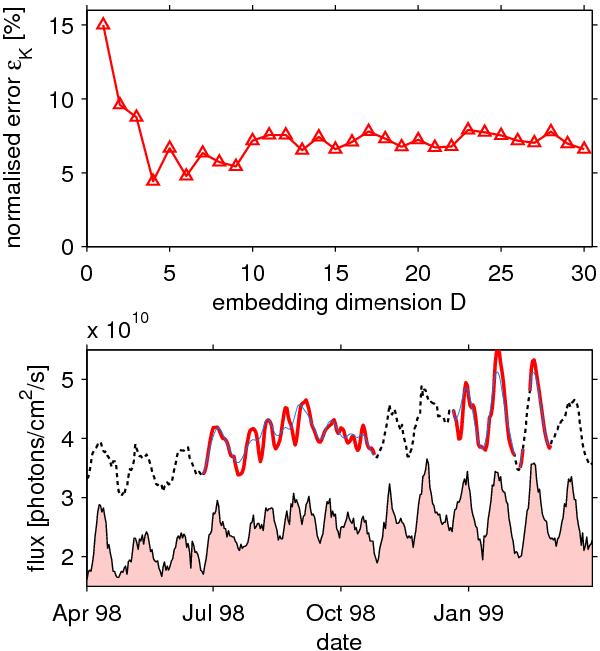
Upper plot: variation of the reconstruction error for the SEM with the embedding dimension D. For each embedding dimension, the number K of modes that minimises the error is chosen. Bottom plot: comparison between the measured flux from the SEM (dashed line) and the flux reconstructed with an embedding dimension of D = 4 (thick line), and D = 15 (thin line). The Mg ii index is shown for comparison (filled curve), with arbitrary units.
Current usage metrics show cumulative count of Article Views (full-text article views including HTML views, PDF and ePub downloads, according to the available data) and Abstracts Views on Vision4Press platform.
Data correspond to usage on the plateform after 2015. The current usage metrics is available 48-96 hours after online publication and is updated daily on week days.
Initial download of the metrics may take a while.