Fig. 8
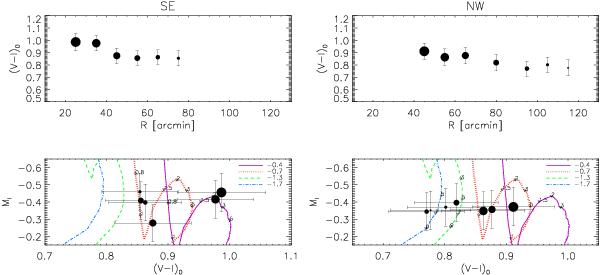
Mean colour of the RC as a function of the angular distance from the centre of M 33 in the southern (top-left) and northern (top-right) fields. The size of the dots decreases with the distance to the M 33 centre. A clear colour gradient is found in both regions. Mean theoretical RC colour and magnitude for different metal abundances (from [M/H] = −0.4 to [M/H] = −1.7) and ages are displayed in the bottom panels. The numbers along the model indicate different ages in Gyr units. The size of the filled dots in the lower panels is the same as in the upper panel to identify the different radial bins.


Current usage metrics show cumulative count of Article Views (full-text article views including HTML views, PDF and ePub downloads, according to the available data) and Abstracts Views on Vision4Press platform.
Data correspond to usage on the plateform after 2015. The current usage metrics is available 48-96 hours after online publication and is updated daily on week days.
Initial download of the metrics may take a while.