Free Access
Fig. 5
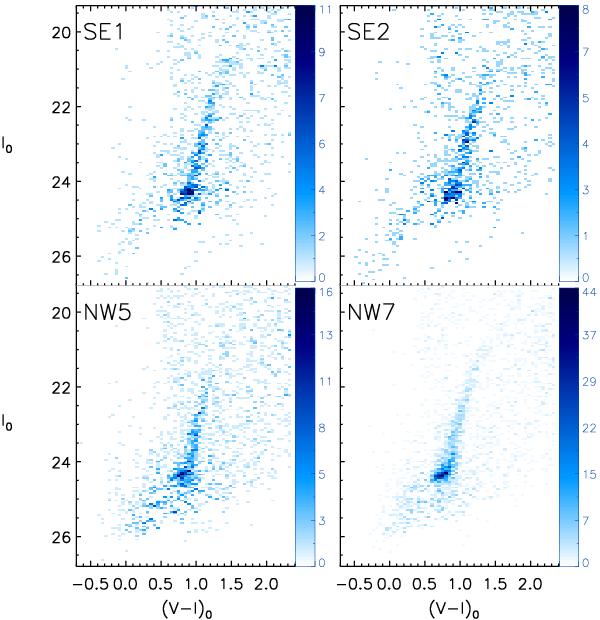
Contamination-subtracted Hess diagrams of field SE1 (top-left), SE2 (top-right), NW5 (bottom-left), and NW7 (bottom-right). The resolution of the diagrams is 0.05 × 0.05 mag, and the colour scale indicates the number of stars per pixel. Only positive residuals are shown in the diagrams.
Current usage metrics show cumulative count of Article Views (full-text article views including HTML views, PDF and ePub downloads, according to the available data) and Abstracts Views on Vision4Press platform.
Data correspond to usage on the plateform after 2015. The current usage metrics is available 48-96 hours after online publication and is updated daily on week days.
Initial download of the metrics may take a while.