Fig. 12
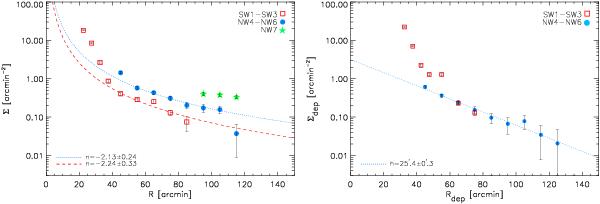
Stellar surface density profiles in the observed fields versus projected (left) and deprojected (right) radius. The open squares and filled dots show the stellar surface density in the SE1-SE3, and NW4-NW6 fields, respectively. Star symbols indicate the density at large radii when field NW7 is also included. The M 33 stellar disc extends out to 40′, while at larger radii there is a clear change in the surface density. A power-law profile (Rn) is fitted to the data in the left panel to investigate the presence of a stellar halo. We did not attempt to fit the star points because of the anomalous overdensity in field NW7. An extended disc component (e−R/h) is fitted to the data in the right panel. The best-fit parameters for each model are displayed in the panels.
Current usage metrics show cumulative count of Article Views (full-text article views including HTML views, PDF and ePub downloads, according to the available data) and Abstracts Views on Vision4Press platform.
Data correspond to usage on the plateform after 2015. The current usage metrics is available 48-96 hours after online publication and is updated daily on week days.
Initial download of the metrics may take a while.