Fig. 11
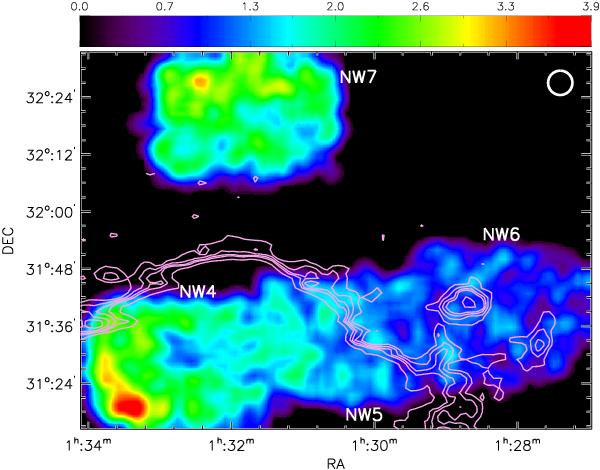
Spatial distribution of RGB and RC stars with 20.7 mag < I < 24.6 mag in the northern fields. The resolution of the map is 1′ × 1′ , smoothed with a Gaussian kernel of 5 pixels FWHM (shown at the top-right corner of the figure). The colour scale indicates the number of stars per pixel. The density contours of the Hi clouds detected in this region are overlaid as a comparison. Contours are at 3.5, 6, 8.5, 11, 13.5 × 1018 cm-2.
Current usage metrics show cumulative count of Article Views (full-text article views including HTML views, PDF and ePub downloads, according to the available data) and Abstracts Views on Vision4Press platform.
Data correspond to usage on the plateform after 2015. The current usage metrics is available 48-96 hours after online publication and is updated daily on week days.
Initial download of the metrics may take a while.