Fig. 9
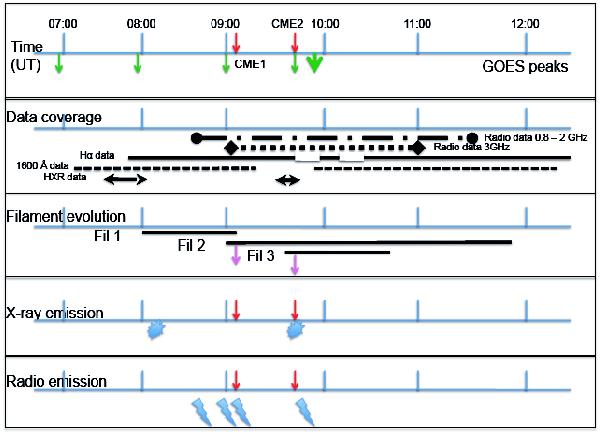
Timeline of the the data coverage and of the main results deduced at different wavelengths. From top to bottom, first panel: timeline indicating the GOES X-ray peaks (green arrows; the greater green arrow indicates the time of the peak of the X3.8 flare, while the red arrows indicate the back-extrapolated take-off times of the CMEs). Second panel: data coverage during the LDE (the dotted-continuous line indicates radio data acquired in the range 0.8−2.0 GHz; the dotted line indicates radio data at 3 GHz; the continuous line indicates the Hα data coverage (there are two gaps: 09:50−09:58 UT and 10:07−10:25 UT); the broken line indicates the 1600 Å TRACE data coverage; the lines with arrows indicate the RHESSI HXR coverage). Third panel: time intervals relevant to the three filament destabilization or eruption; the magenta arrows indicate the times of the eruptions of filaments 2 and 3. Fourth and fifth panels indicate with symbols the main emission in the HXR and radio ranges, respectively (see text).
Current usage metrics show cumulative count of Article Views (full-text article views including HTML views, PDF and ePub downloads, according to the available data) and Abstracts Views on Vision4Press platform.
Data correspond to usage on the plateform after 2015. The current usage metrics is available 48-96 hours after online publication and is updated daily on week days.
Initial download of the metrics may take a while.