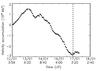
Fig. 7
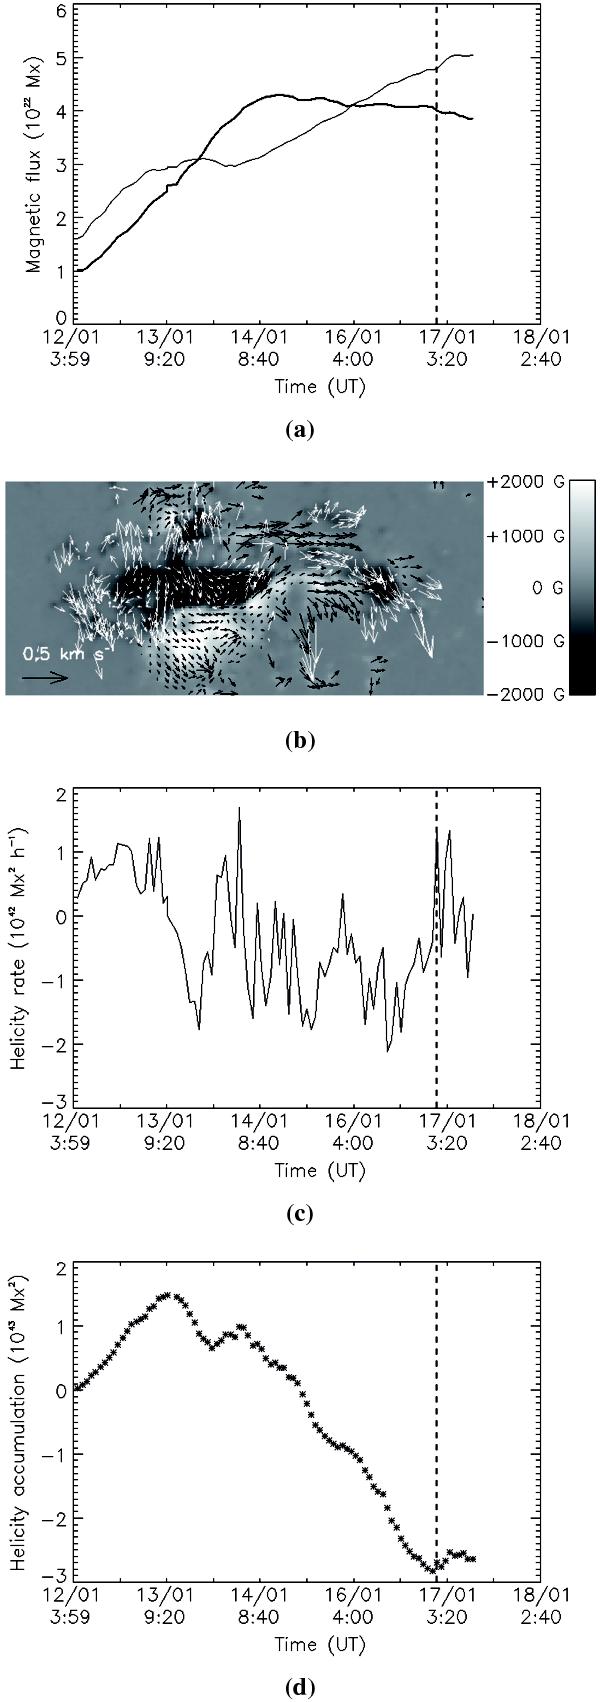
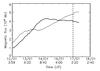
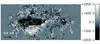
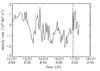
a) Magnetic flux in NOAA 10720 as a function of time: the thin (thick) line indicates the negative (positive) flux. b) Horizontal velocity fields measured in NOAA 10720 on 17 January 2005; the fov is 400 × 200 arcsec. c) Magnetic helicity rate measured in NOAA 10720 during the period analyzed. d) Magnetic helicity accumulation in NOAA 10720. The vertical dotted lines indicate the time of occurrence of the X3.8 flare.
Current usage metrics show cumulative count of Article Views (full-text article views including HTML views, PDF and ePub downloads, according to the available data) and Abstracts Views on Vision4Press platform.
Data correspond to usage on the plateform after 2015. The current usage metrics is available 48-96 hours after online publication and is updated daily on week days.
Initial download of the metrics may take a while.