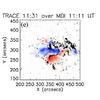
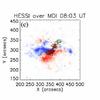
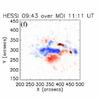
Fig. 4
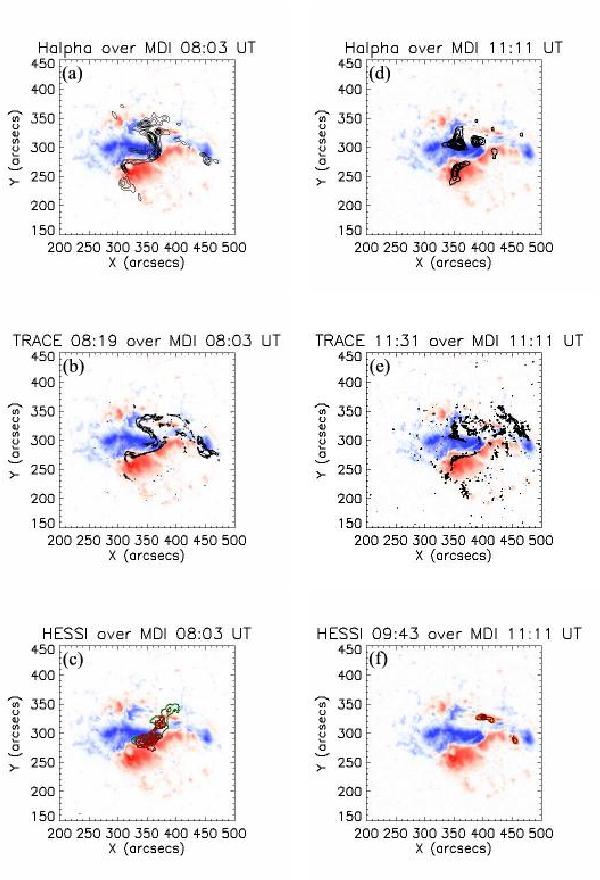
Hα isocontours overplotted on MDI magnetograms during the rise a) and the main phase d) of the flare; red (blue) colors indicate positive (negative) polarity. Overplots of 1600 Å TRACE isocontours on the corresponding MDI magnetograms during the rise b) and main phase e) of the flare. The contours levels are at 60, 70, 80, and 90% of maximum 1600 Å intensity in b), while they are at 70, 80, and 90% in e). Overplots of RHESSI isocontours over MDI magnetograms taken during the rise c) and main phase f) of the X3.8 flare. RHESSI data are integrated for 30 s around 08:04 UT c) and 09:43 UT f). Green isocontours indicate the emission at 12−25 keV, while orange and red isocontours indicate the emission at 25−50 keV and 50−100 keV, respectively. The contour levels are at 50, 60, 70, 80, 90, and 95% of maximum intensity.
Current usage metrics show cumulative count of Article Views (full-text article views including HTML views, PDF and ePub downloads, according to the available data) and Abstracts Views on Vision4Press platform.
Data correspond to usage on the plateform after 2015. The current usage metrics is available 48-96 hours after online publication and is updated daily on week days.
Initial download of the metrics may take a while.