Fig. 2
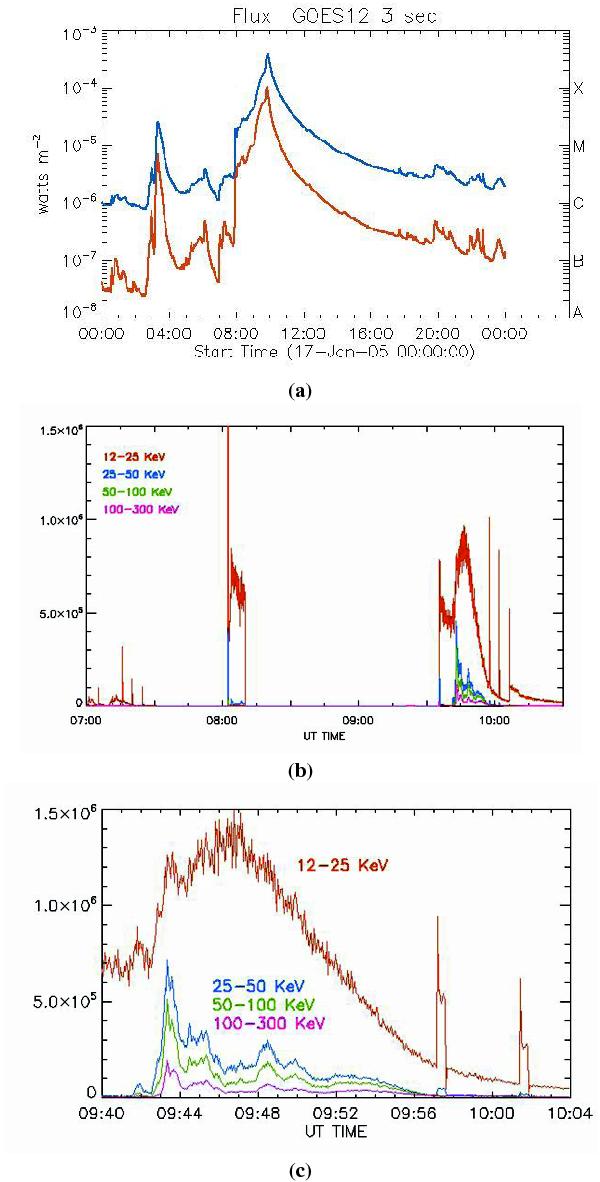
a) GOES-12 X-ray flux in the 0.5−4.0 Å band (red line) and in the 1.0−8.0 Å band (blue line) on 17 January 2005. The graph shows the occurrence of an X3.8 flare, with a peak of intensity at 09:52 UT. b) Light curve showing the X-ray emission measured by RHESSI at different energy bands during the time interval 07:00−10:30 UT. c) RHESSI X-ray light curve showing in more detail the time interval 09:40−10:05 UT. The spikes are probably of instrumental origin.
Current usage metrics show cumulative count of Article Views (full-text article views including HTML views, PDF and ePub downloads, according to the available data) and Abstracts Views on Vision4Press platform.
Data correspond to usage on the plateform after 2015. The current usage metrics is available 48-96 hours after online publication and is updated daily on week days.
Initial download of the metrics may take a while.