Open Access
Fig. 4
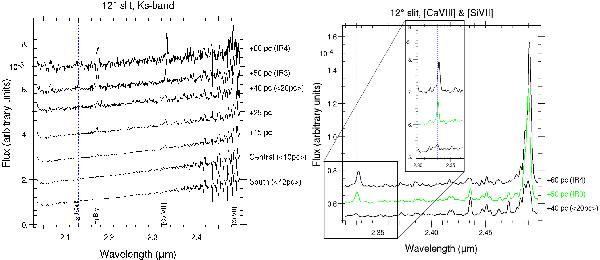
Ks-band spectra extracted from various regions along the slit with identified IR emission lines. These spectra were renormalized to be displayed on the same plot. The line intensity variation is not absolute.
Current usage metrics show cumulative count of Article Views (full-text article views including HTML views, PDF and ePub downloads, according to the available data) and Abstracts Views on Vision4Press platform.
Data correspond to usage on the plateform after 2015. The current usage metrics is available 48-96 hours after online publication and is updated daily on week days.
Initial download of the metrics may take a while.