Fig. 2
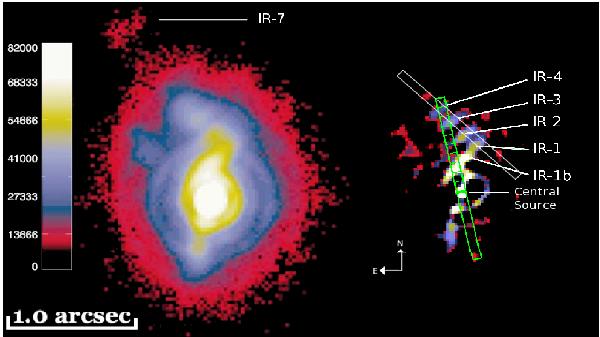
Nodule identification and slit orientation on M′-band image (left) and its deconvolved image (right). The distance between the ticks inside the slit is 0.1″ i.e. about 7.5 pc. In white, the 47° PA slit aligned with the nodules. In green, the 12° PA slit. The colors are in arbitrary units and are chosen so that the structures mentioned in this article appear clearly.
Current usage metrics show cumulative count of Article Views (full-text article views including HTML views, PDF and ePub downloads, according to the available data) and Abstracts Views on Vision4Press platform.
Data correspond to usage on the plateform after 2015. The current usage metrics is available 48-96 hours after online publication and is updated daily on week days.
Initial download of the metrics may take a while.