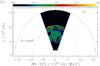
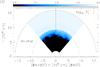
Fig. 3
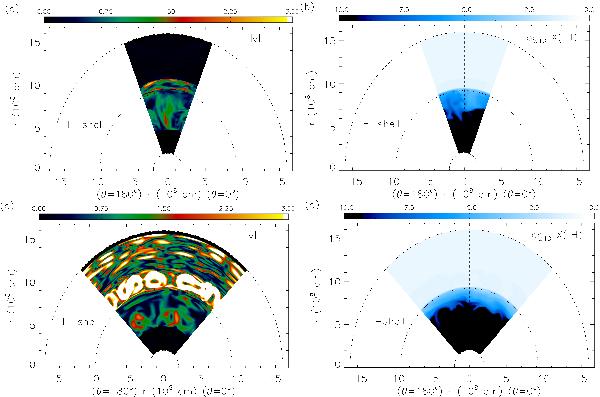
Top row: snapshots showing contour plots of the modulus of the velocity |v| (in units of 106 cm s-1; left panel) and the hydrogen mass fraction (right panel) for the 3D model hifexp.3d.f at t ~ 13 300 s in the meridional plane (φ = 0°). Bottom row: same quantities but for the 2D model hifexp.2d.f. The dotted line separates helium- and hydrogen-rich layers (H-shell), and the dashed lines mark the boundaries of the computational domain.
Current usage metrics show cumulative count of Article Views (full-text article views including HTML views, PDF and ePub downloads, according to the available data) and Abstracts Views on Vision4Press platform.
Data correspond to usage on the plateform after 2015. The current usage metrics is available 48-96 hours after online publication and is updated daily on week days.
Initial download of the metrics may take a while.