Fig. 1
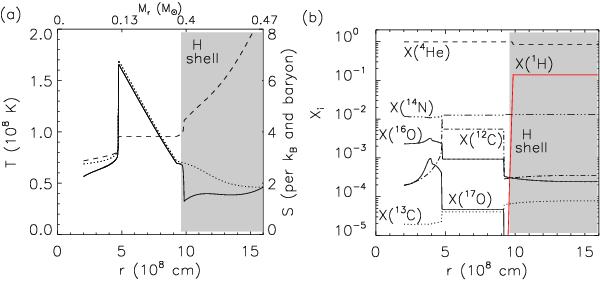
a) Temperature distribution of the modified initial model (MOD, solid) and of the original model (M, dotted) as a function of both radius r and the enclosed mass Mr in solar units M⊙, respectively. The dashed curve gives the entropy profile of model MOD. b) Mass fraction of the main isotopes of model MOD as a function of radius. The hydrogen shell corresponds to the shaded region.
Current usage metrics show cumulative count of Article Views (full-text article views including HTML views, PDF and ePub downloads, according to the available data) and Abstracts Views on Vision4Press platform.
Data correspond to usage on the plateform after 2015. The current usage metrics is available 48-96 hours after online publication and is updated daily on week days.
Initial download of the metrics may take a while.