Free Access
Fig. 7
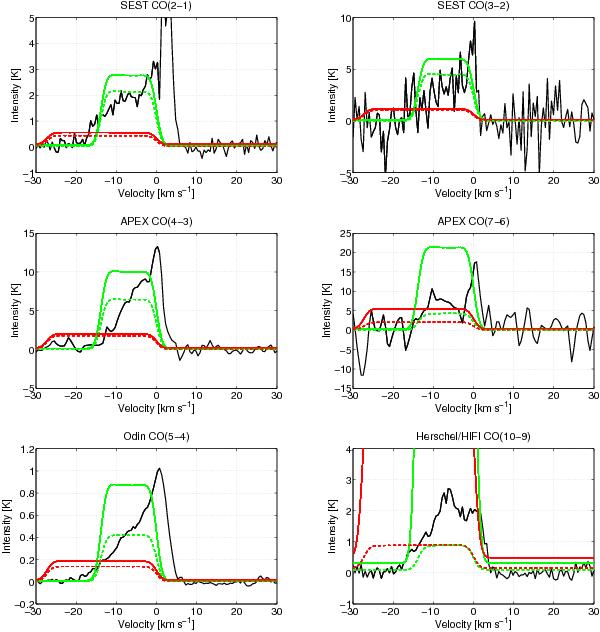
The red (1000 K) and green (400 K) lines represent the model described in Neufeld et al. (2006), using pre-shock densities of 104 cm-3 (dashed) and 105 cm-3 (solid). The observed spectra from SEST, APEX, Odin, and HIFI are plotted with black solid lines. The modelled spectra have not been baselines subtracted.
Current usage metrics show cumulative count of Article Views (full-text article views including HTML views, PDF and ePub downloads, according to the available data) and Abstracts Views on Vision4Press platform.
Data correspond to usage on the plateform after 2015. The current usage metrics is available 48-96 hours after online publication and is updated daily on week days.
Initial download of the metrics may take a while.