Free Access
Fig. 2
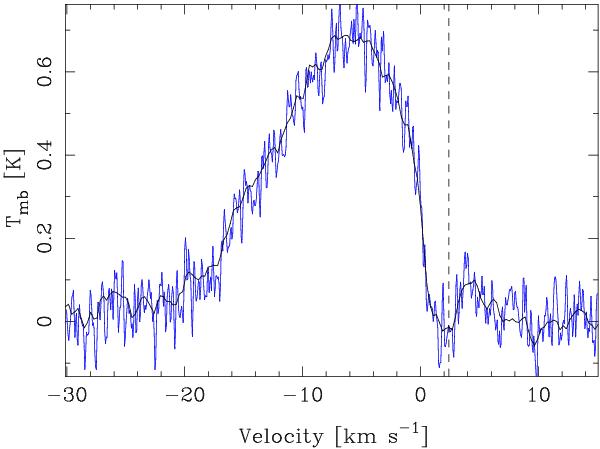
H2O (110−101) spectra obtained with HIFI. The blue spectral line is the HRS, and the black spectral line is the WBS. Both observations were centred on HH 54 B: α2000 = 12h55m50 3, δ2000 = −76°56′23′′. The dashed line indicates the position of the velocity of the cloud.
Current usage metrics show cumulative count of Article Views (full-text article views including HTML views, PDF and ePub downloads, according to the available data) and Abstracts Views on Vision4Press platform.
Data correspond to usage on the plateform after 2015. The current usage metrics is available 48-96 hours after online publication and is updated daily on week days.
Initial download of the metrics may take a while.