Fig. 14
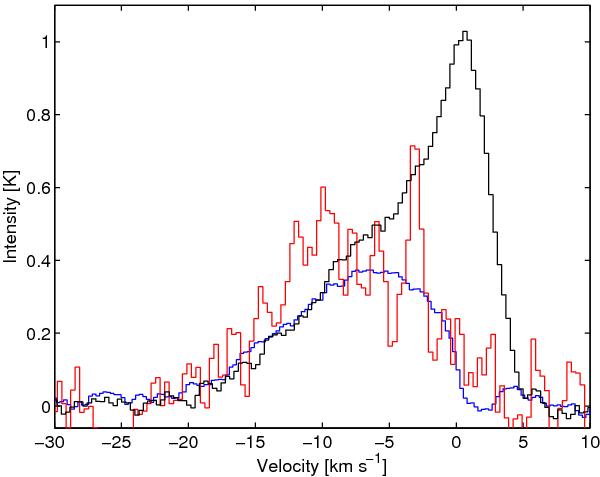
Comparison between the CO (5−4) line (black) and the H2O (110−101) line obtained with Odin (red). The H2O spectrum has been multiplied by 6 for clarity. Also the HIFI H2O (110−101) spectrum has been plotted in this figure for comparison (blue). The intensity of the emission has in this case been multiplied by 6 and corrected for beam filling.
Current usage metrics show cumulative count of Article Views (full-text article views including HTML views, PDF and ePub downloads, according to the available data) and Abstracts Views on Vision4Press platform.
Data correspond to usage on the plateform after 2015. The current usage metrics is available 48-96 hours after online publication and is updated daily on week days.
Initial download of the metrics may take a while.