Fig. 13
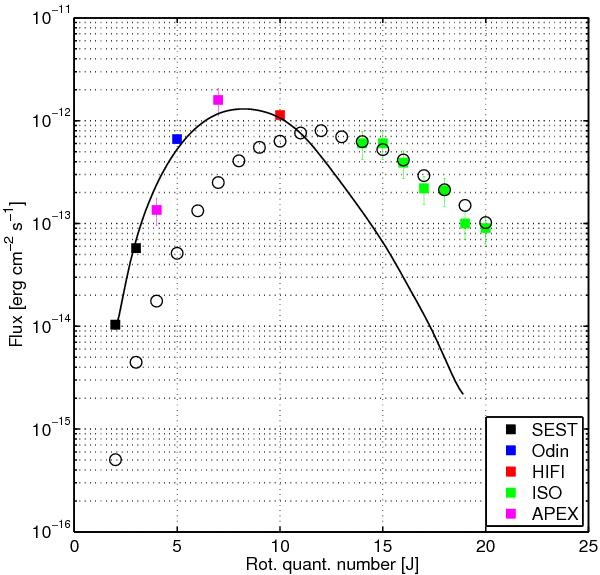
Observed CO line fluxes (squares) as a function of the rotational quantum number J. The errorbars are the estimated calibration uncertainties (10% for SEST, Odin, and HIFI and 30% for APEX and ISO). The best-fit model, described in the present paper (see Sect. 4.3.1), is indicated with a solid line. The fit to the high-J CO lines is indicated with black circles (see Sect. 4.3.5).
Current usage metrics show cumulative count of Article Views (full-text article views including HTML views, PDF and ePub downloads, according to the available data) and Abstracts Views on Vision4Press platform.
Data correspond to usage on the plateform after 2015. The current usage metrics is available 48-96 hours after online publication and is updated daily on week days.
Initial download of the metrics may take a while.