Free Access
Fig. 10
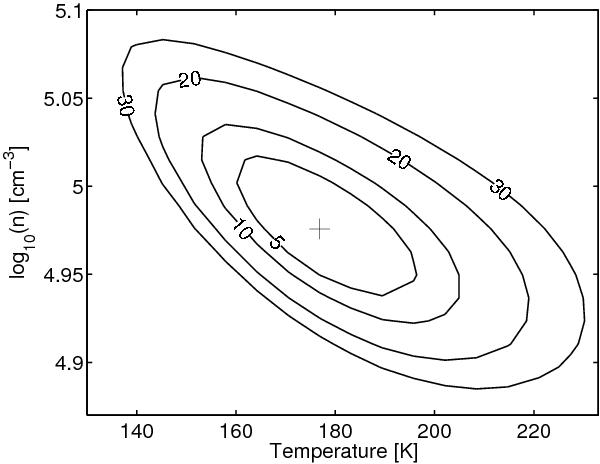
Contour plot showing the sum of the chi-squares when comparing the modelled spectra and the observations. The 5%, 10%, 20%, and 30% deviations from the minimum value are indicated with solid lines. The best-fit density and temperature are indicated with a cross.
Current usage metrics show cumulative count of Article Views (full-text article views including HTML views, PDF and ePub downloads, according to the available data) and Abstracts Views on Vision4Press platform.
Data correspond to usage on the plateform after 2015. The current usage metrics is available 48-96 hours after online publication and is updated daily on week days.
Initial download of the metrics may take a while.