Fig. 1
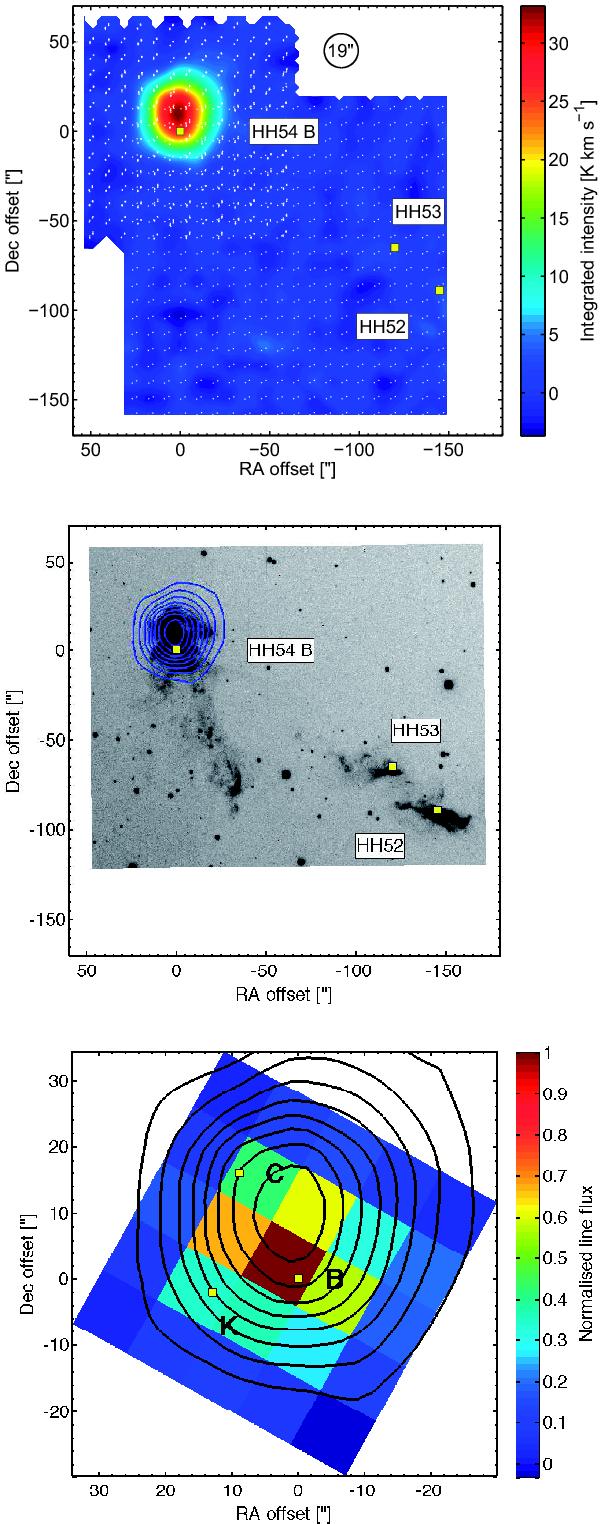
Upper panel: false colour map of the CO (10−9) integrated intensity in the blue line wing (from +2.4 km s-1 to −30 km s-1). The positions of HH 54 B, HH 53, and HH 52 are indicated with yellow squares. The readout positions for the on-the-fly and raster maps are indicated with white dots. Middle panel: CO (10−9) map of the integrated intensity obtained with HIFI in the blue line wing overlaid on an Hα image from Caratti o Garatti et al. (2009). Contours are from 5.5 to 33.6 K km s-1 in steps of 3.5 K km s-1. Lower panel: a zoom of the CO (10−9) integrated intensity overlaid on the H2O (212−101) emission obtained with PACS. The positions of HH 54 B, C and K as indicated in Giannini et al. (2006) are indicated with yellow squares.
Current usage metrics show cumulative count of Article Views (full-text article views including HTML views, PDF and ePub downloads, according to the available data) and Abstracts Views on Vision4Press platform.
Data correspond to usage on the plateform after 2015. The current usage metrics is available 48-96 hours after online publication and is updated daily on week days.
Initial download of the metrics may take a while.