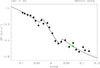
Fig. 3
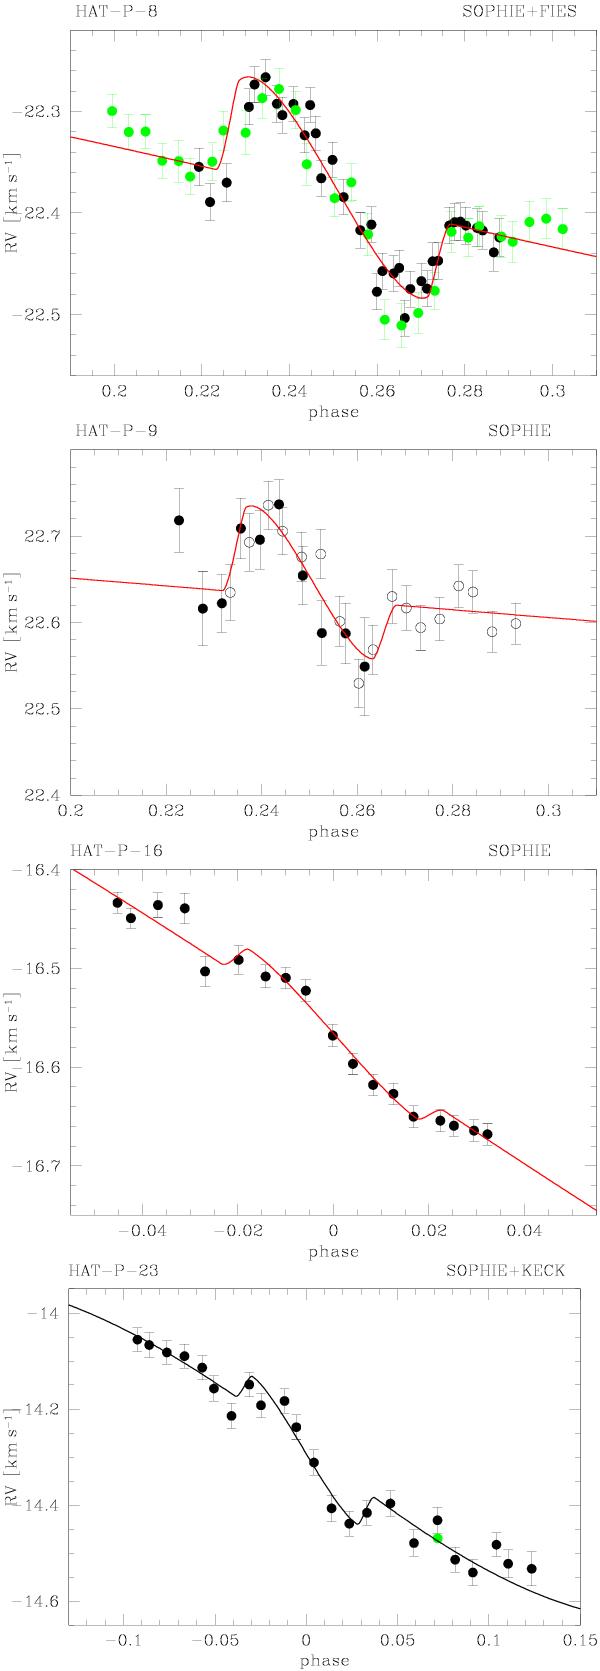
Close-up view of the radial-velocity measurements of HAT-P-8, HAT-P-9, HAT-P-16, and HAT-P-23 obtained with SOPHIE during transit nights. The best-fit Rossiter-McLaughlin models are superimposed as a red dashed line. FIES data of HAT-P-8 are included as green circles (Simpson et al. 2010). Data for two separate observing nights are shown with different symbols for HAT-P-9 (filled circles: 28 December 2010, open circles: 1 January 2011).
Current usage metrics show cumulative count of Article Views (full-text article views including HTML views, PDF and ePub downloads, according to the available data) and Abstracts Views on Vision4Press platform.
Data correspond to usage on the plateform after 2015. The current usage metrics is available 48-96 hours after online publication and is updated daily on week days.
Initial download of the metrics may take a while.